Chart gallery
Every chart Beacon draws, rendered from the canonical synthetic dataset in both styles. Generated at docs build time, so these are what the code currently produces rather than screenshots taken once.
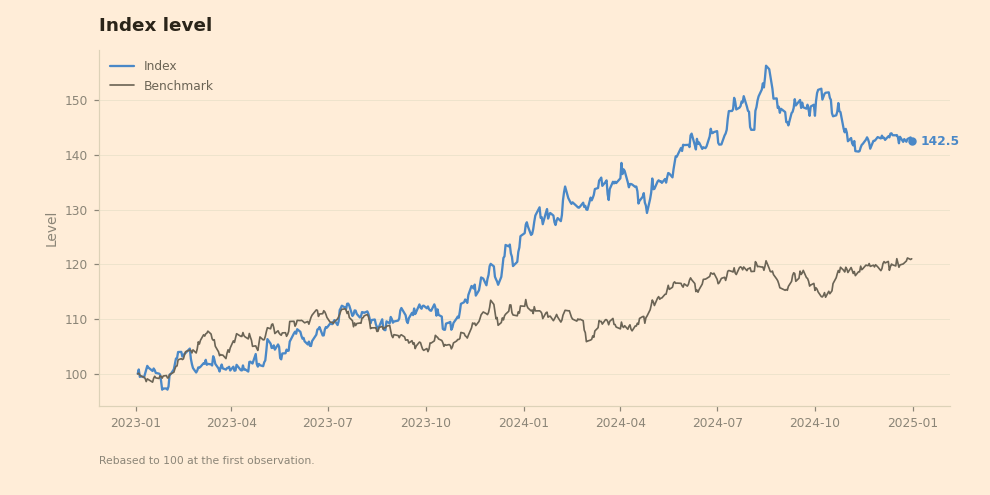
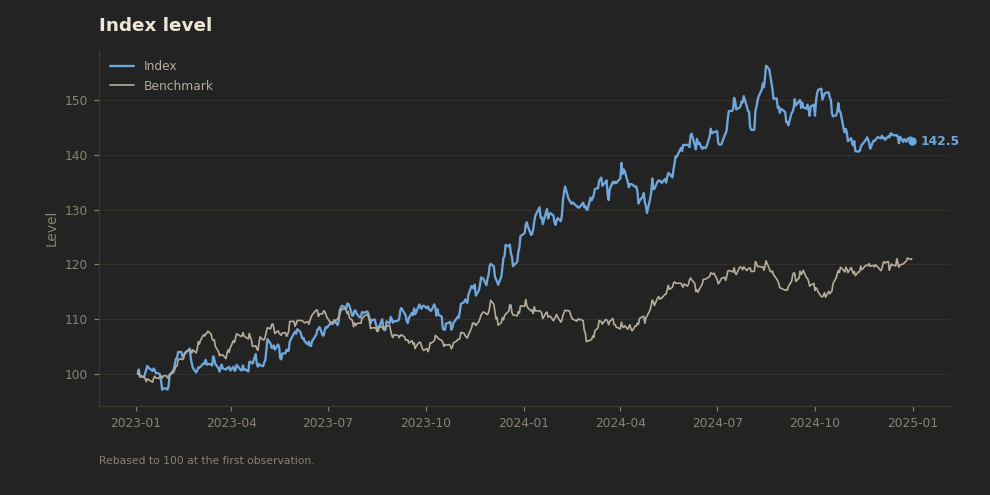
Level
Index level, rebased to 100, against an optional benchmark.
Weights
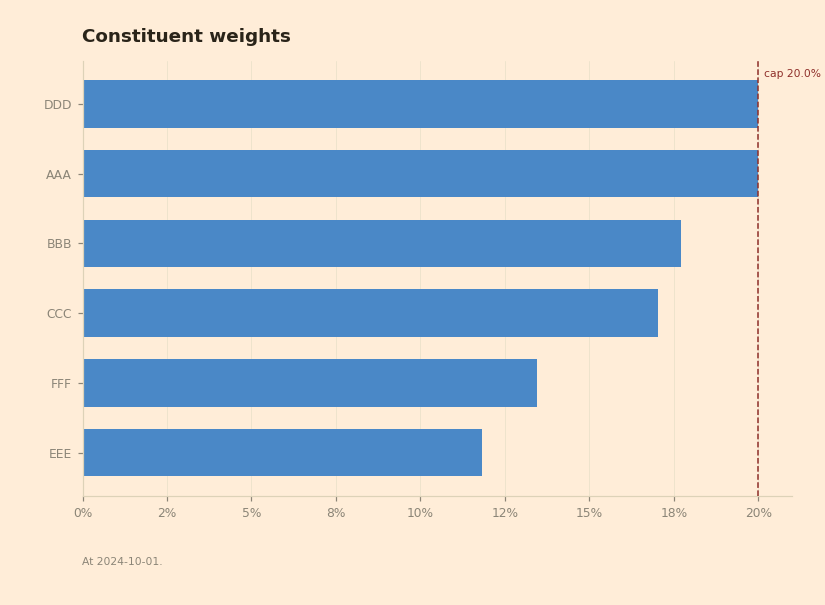
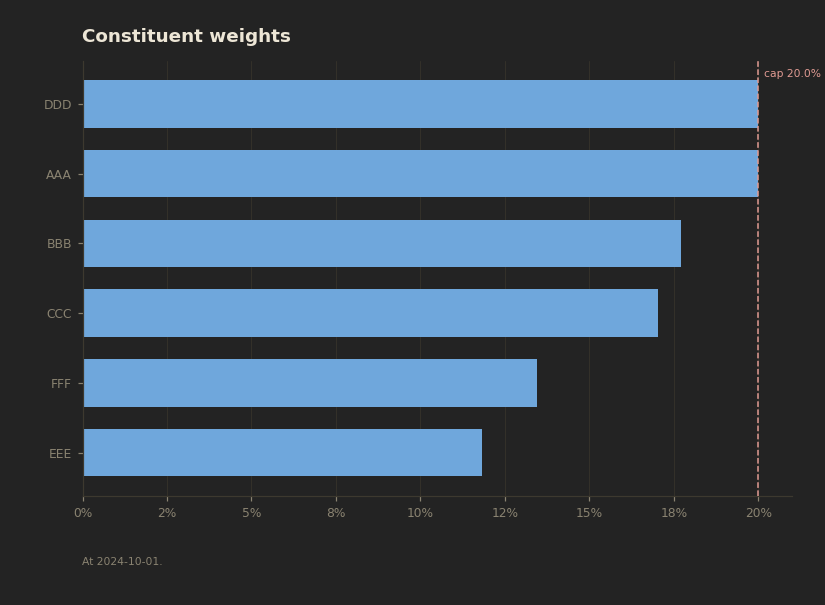
Constituent weights at a rebalance, with the cap marked.
Performance
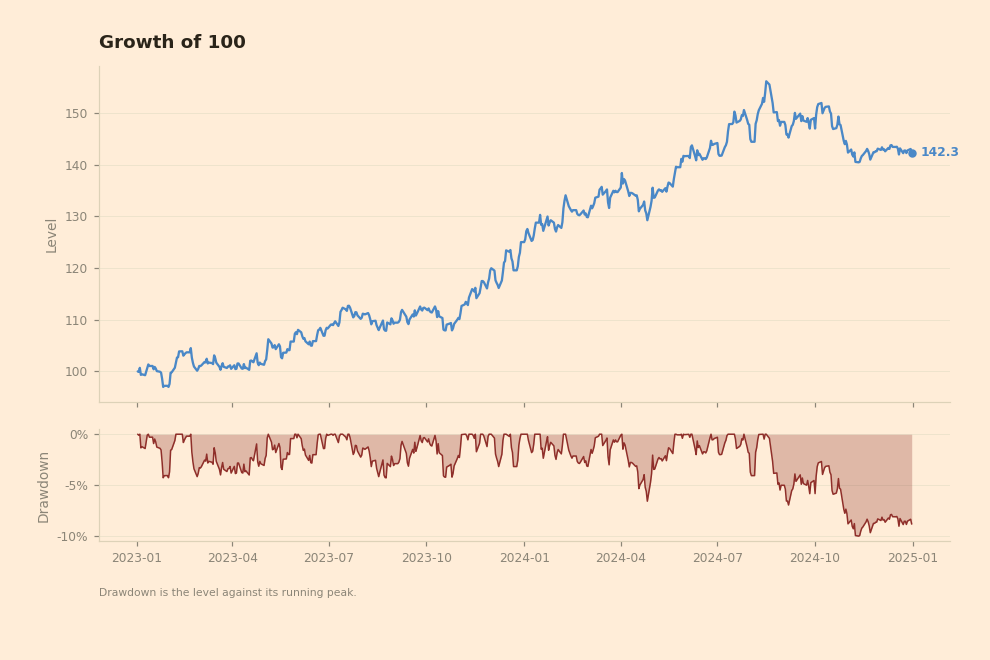
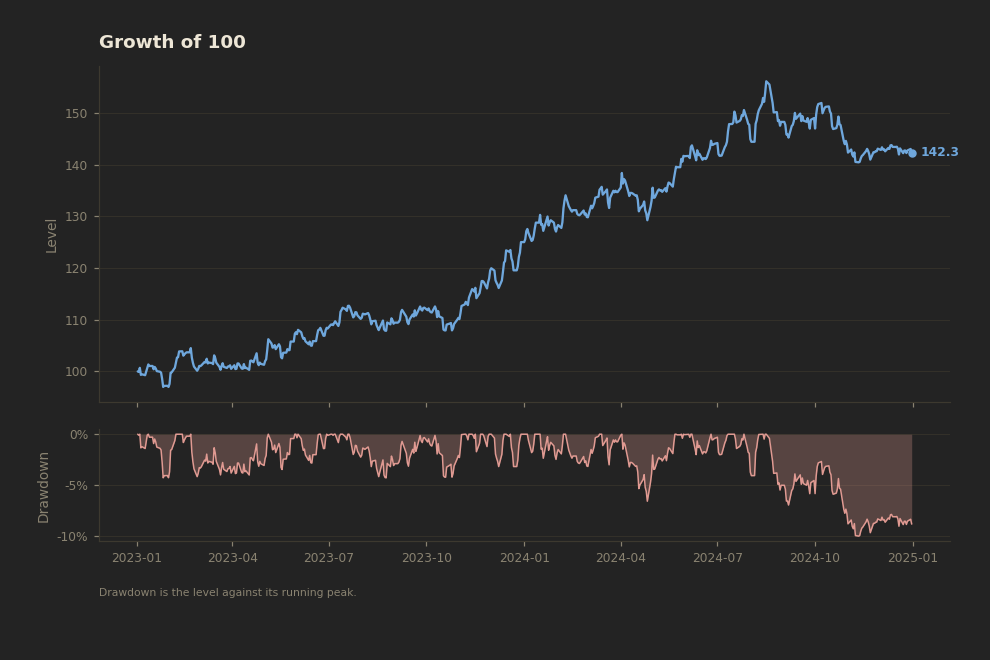
Growth of 100 with a linked drawdown panel.
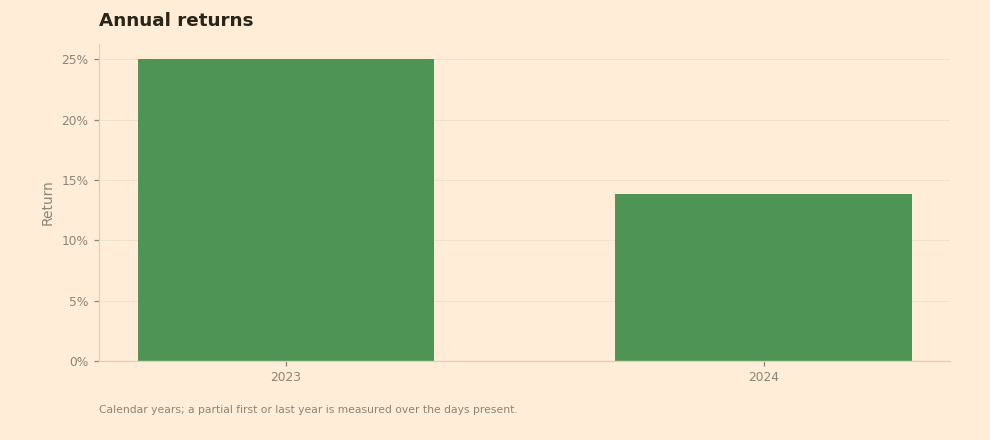
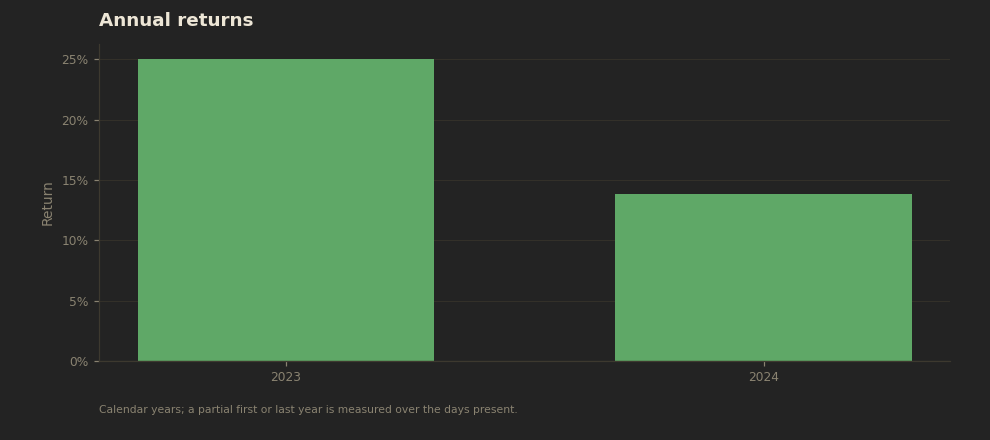
Annual returns
Calendar-year returns as signed bars.
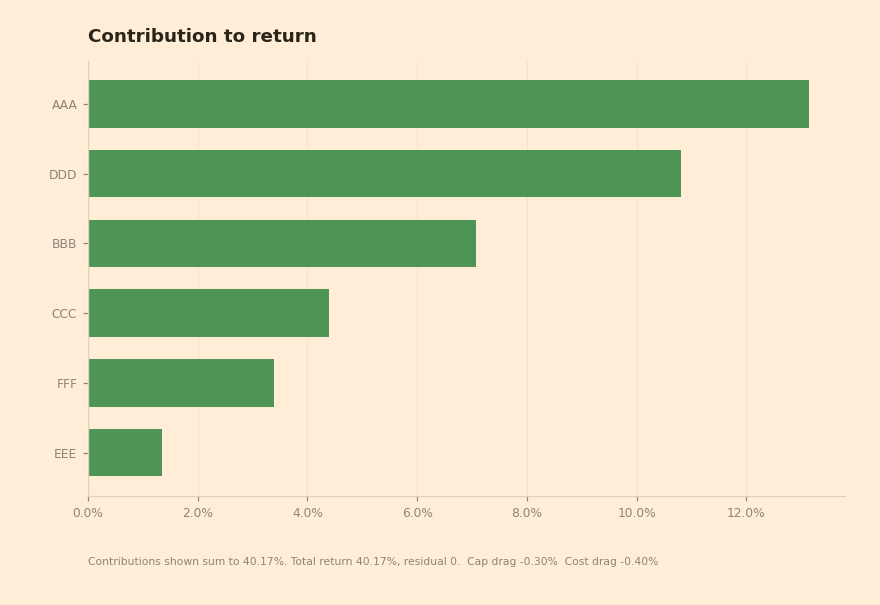
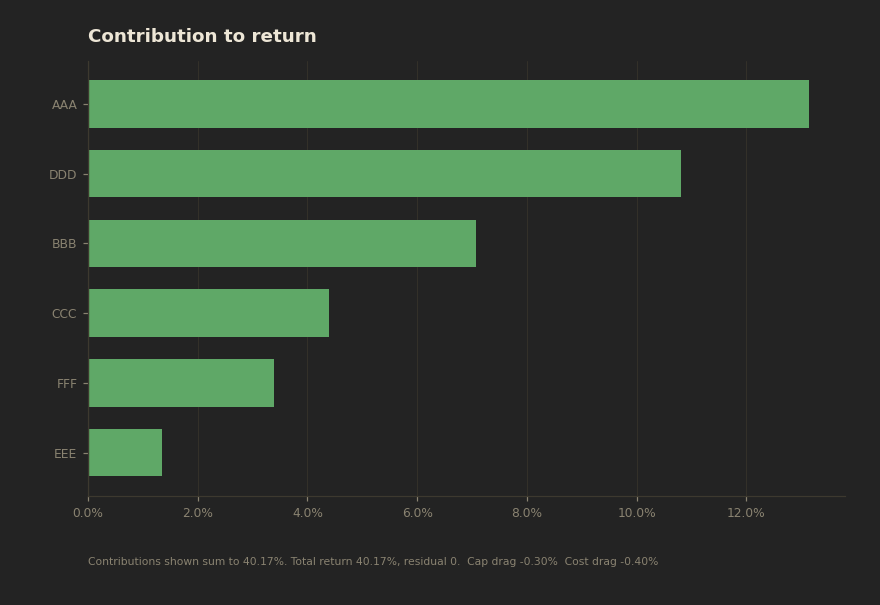
Contributions
Per-constituent contribution to return, with the drags.
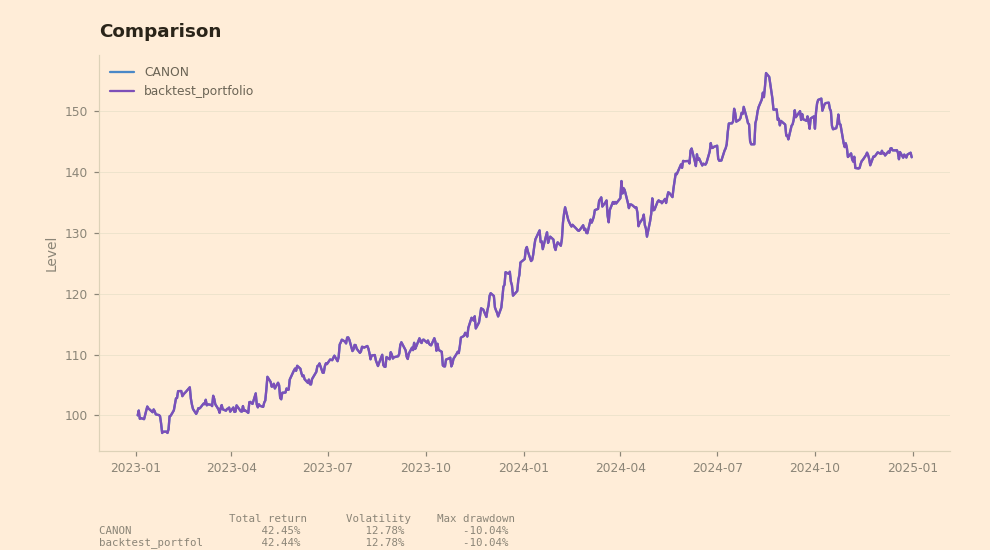
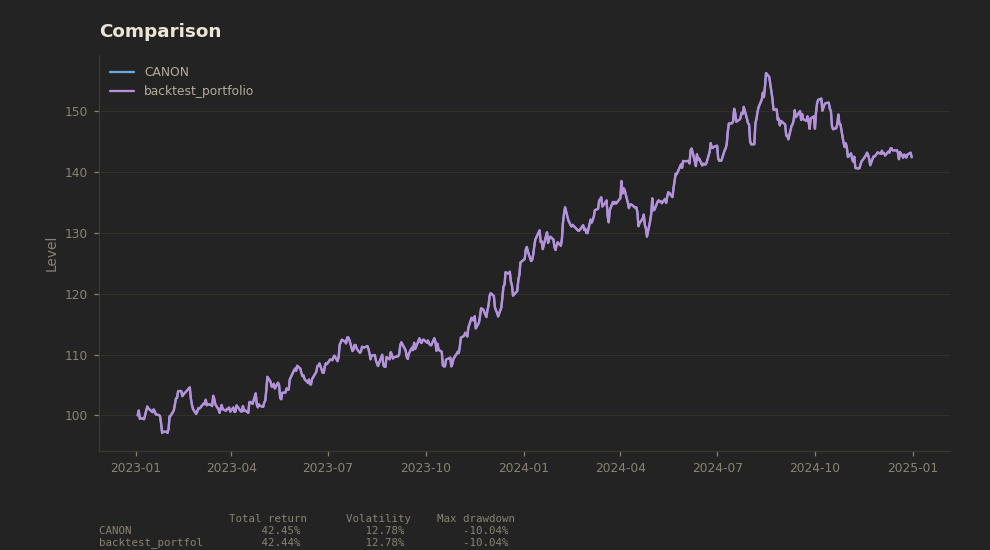
Compare
Several results on one axis, rebased on their shared window.
Exposures
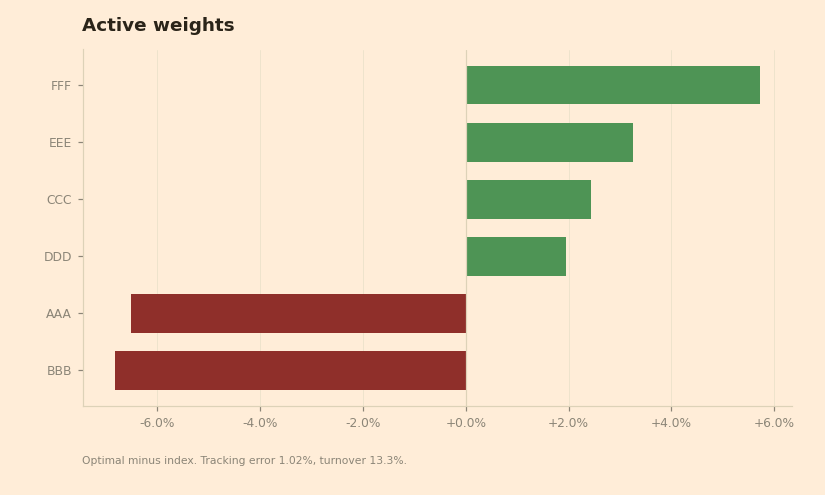
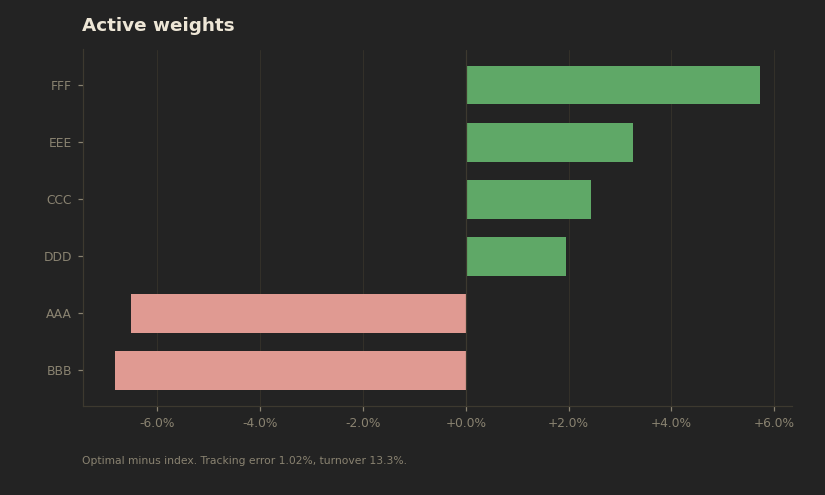
Active weights against the index, sign-coloured.
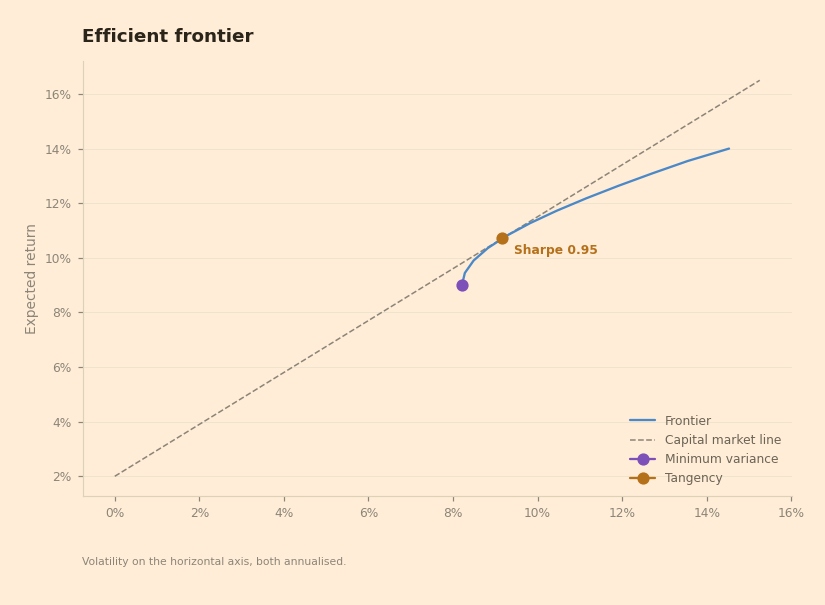
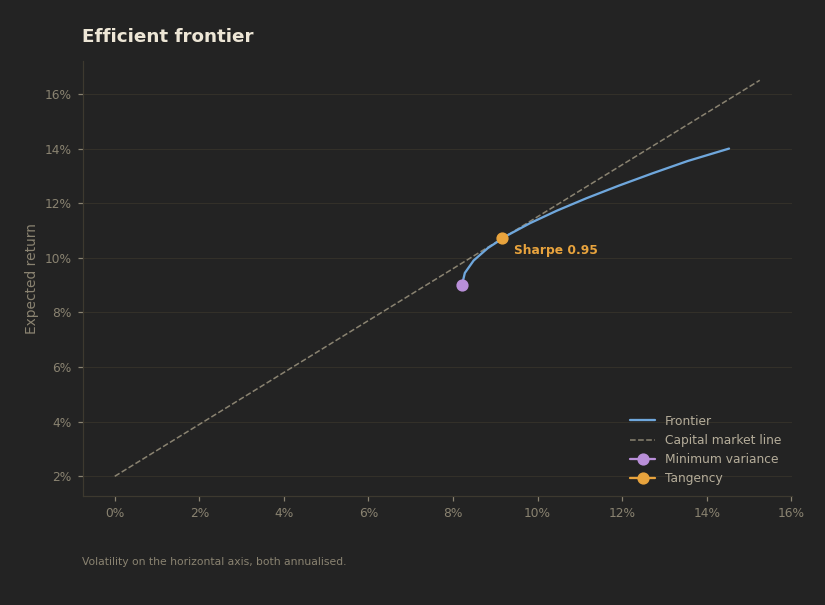
Frontier
The efficient frontier, its named points and the capital market line.
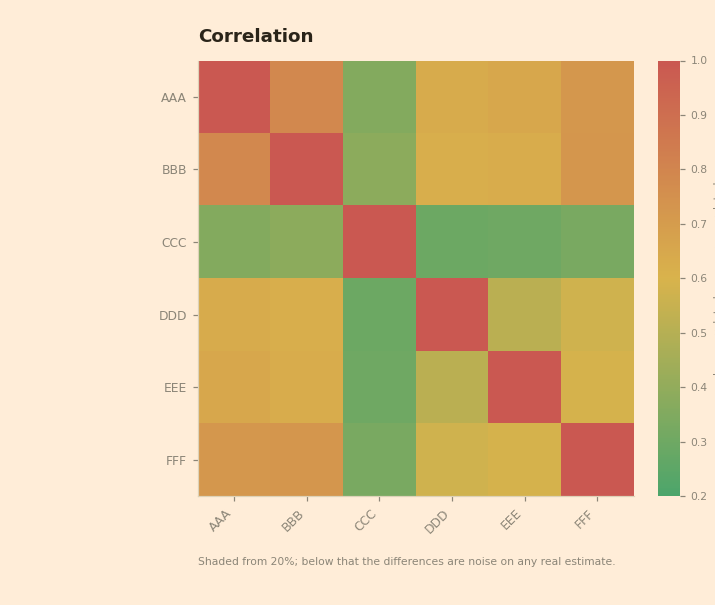
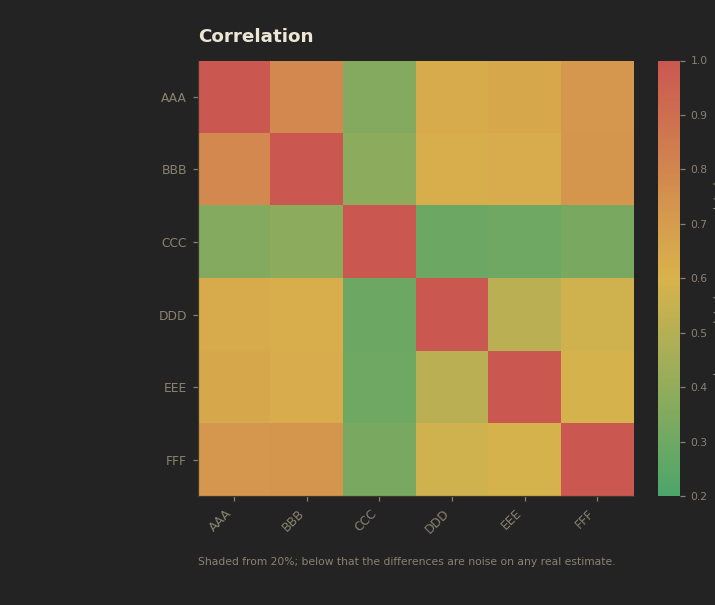
Correlation
Correlation matrix on the beacon_corr scale.